The use of maps as an aid to historical research and the history of the Ordnance Survey
Introduction
This article looks at how maps can aid research, the history of the Ordnance Survey and analysis of areas of an old six inch map located to the north of Wigan.
Today with the invention of Sat Nav and the introduction of Google maps and street view finding your way around has never been easier. At the same time however the art of navigating with a paper map is being lost.
Serious walkers and ramblers will have no problems but many people are confused by maps and find them hard to understand and interpret, but all the information you need is printed either on the map or around the margins. I can look at maps for hours on end, just like reading a book, and in my mind’s eye I can convert the landscape from two to three dimensional. All it takes is a little practice.
Maps as an aid to research
Older maps are an invaluable resource for historians and genealogists. They go hand in hand with all the other resources used for historical research. A great source are the 'Godfrey Old Ordnance Survey Maps' series. Alan Godrey has so far published over 3,500 of these street maps for towns in Great Britain.
The Godfrey maps are highly detailed, showing individual houses, railway tracks, factories, churches, mills, canals, tramways and even minutiae such as dockside cranes, fountains, signal posts, pathways, sheds, wells, etc. Each separate parcel of land is numbered and it's acreage is recorded but not the name of the parcel or the ownership. For example Whitley Hall is built on plot number 301 and covers just over a third of an acre. Adjoining parcels of land such as No. 302 at 8.126 acres and No. 300 at 6.782 acres may have also come under the ownership of Whitley Hall
The maps are based on the old Ordnance Survey 1 : 2500 scale plans and reprinted at about 14 inches to the mile (1 : 4340). Most maps cover about one mile (1.6 kms) by one and a half miles (2.4 kms) and adjoining sheets can be assembled together to provide wider coverage.
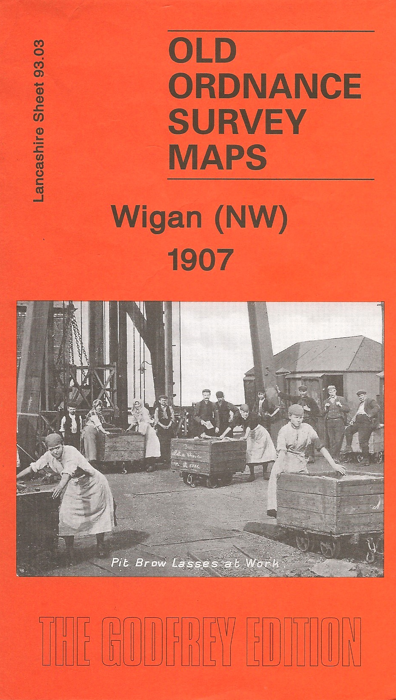
The orange coloured Godfrey map at the top of the page is of Wigan (NW) dated 1907 and is designated as Lancashire Sheet number 93.03. The cover photograph is a typical scene of Wigan pit brow lasses at work. The rear of the map contains interesting historical information regarding the area north west of Wigan.
Also shown on the rear is an extract from 'Seed's' Wigan & District Directory of 1909 which includes Beech Hill Avenue, Beech Hill Lane, Beech Hall Street, Woodhouse Lane and business premises in Shevington.
A random check of the directory shows that Thomas Livesey ran a drapers shop at 67 Beech Hill Avenue, Levi Bibby resided at Beech Hill Hall which was accessed via Beech Hill Lane, Alfred Purse, a warehouse man lived at 5 Beech Hall Street, Arthur Seed ran a fish and chip shop at 9-11 Woodhouse Lane, and John Hilton farmed Highfield Farm in Shevington. Today the maps cost about £5.50 including p&p.
Many maps of various scales and dates can be accessed free online via the National Library of Scotland but some older town maps and tithe maps will require a visit to local studies.
These display streets and buildings that were constructed a couple of centuries or more ago and now no longer exist, especially the numerous yards in the old parts of Wallgate and Scholes. Names of businesses and public houses that have long disappeared can be located. Comparing earlier and later maps helps with dating buildings and streets and show how urbanization has expanded over a period of time in a any particular area.
Tithe maps which pre-date Ordnance Survey maps are an important source of information about the history and topography of a parish. They provide details of land ownership and occupation, and the type of cultivation of the land, and are often the earliest complete maps of parishes.
They were produced in order to assess the tithe payable in cash to the parish church for the support of the church and its clergy. This tithe had been paid in kind until The Commutation Act was passed in 1836, when it was agreed that this should be converted to a monetary payment.
A survey of the whole of England and Wales was undertaken in the decade or so after 1836, to establish the boundaries of each parish, and assess the amount of tithe due for each parcel of land within it. This resulted in the survey of all tithed land in each parish, the production of a map covering the whole parish and a reference book, called an apportionment, identifying each parcel of land with names and acreages.
Ordnance Survey (OS)
Ordnance Survey is the national mapping agency for Great Britain. The agency's name indicates its original military purpose, which was to map Scotland in the wake of the Jacobite Rising of 1745. There was also a more general and nationwide need in light of the potential threat of invasion during the Napoleonic Wars in the late eighteenth century.
In the beginning, the responsibility at first lay with the Board of Ordnance (the predecessor to the Ministry of Defence) based in offices in the Tower of London. The birth of the Ordnance Survey is officially recognised as 21 June 1791, when with the introduction of the newly designed Ramsden Theodolite, the mapping of southern Britain could begin.
The first OS map was published in 1801 to the scale of one inch to the mile. It was of England’s most south-easterly county Kent, which was considered one area most vulnerable to French invasion.
The First Land Survey of Great Britain
Between 1840 and 1860 the first Land Survey (officially known as Geodetic Levelling) of Great Britain began with a bench mark on St. John’s church in Liverpool as the datum point. Four years later the datum point was moved to a tidal pole in Victoria Dock after tidal observations had been taken over a nine day period. This was known as Ordnance Datum Liverpool (ODL). In 1841, a new Act of Parliament, the ‘Survey Act’ gave Ordnance Survey a legal right to... ‘enter into and upon any land… for the purposes of making and carrying out a survey’.
That same year Ordnance Survey’s cramped Tower of London offices were at the centre of a national catastrophe. Fire swept through the Grand Storehouse, threatening to engulf the Crown Jewels in the Martin Tower. Miraculously, the precious Jewels were saved, and most of Ordnance Survey’s records and instruments were also carried to safety. But the fire highlighted the Survey’s desperate need for more office space and prompted a move to a new Southampton headquarters in an empty former army barrack building.
OS County Series Maps
The Ordnance Survey County Series maps of Great Britain were produced from the 1840s to the 1890s, with revisions published until the 1940s. The series mapped the counties at both a six inch and twenty-five inch scale with accompanying acreage and land use information. Following the introduction of the OS National Grid in the 1930s the County Series maps were replaced by a new series of maps at each scale.
Lancashire is covered by 118 six inch scale sheets (each measuring 12 x 18 inches) and was surveyed between 1842 and 1849, the county was then re-surveyed and revised between 1888 and 1893. The 6" sheets covered an area of six by four miles on the ground; the 25" sheets covered an area of one mile by one and a half miles. One square inch on the twenty-five inch maps was roughly equal to an acre on the ground. In later editions the 6" sheets were published in "quarters" (NW, NE, SW, SE), each covering an area of three miles by two miles on the ground.
The six-inch maps record most man-made and natural features in the landscape. Every road, railway, field, fence, wall, stream and building is shown, and even smaller features such as letter boxes, bollards on quaysides, mile posts, and flag-staffs. Sites of antiquities are shown and uncultivated land is distinguished by different symbols for marsh, bog, and rough grassland, types of woodland are distinguished, as well as parks, ornamental grounds and orchards.
During the first half of the 20th century, the OS produced many 'Restricted' versions of the County Series maps and other War Department sheets used for War Office purposes. They were in a variety of scales that included details of military significance such as dockyards, naval installations, fortifications, military camps and armament factories etc. Apart from a brief period during the disarmament talks of the 1930s, these areas were left blank or incomplete on standard maps.
All public boundaries and administrative boundaries, including civil parish, burgh, and county boundaries, are clearly shown, apart from certain boundaries within towns. Spot heights in feet above mean sea level are shown along roads, railways, etc., and the six-inch maps are the most detailed scale at which contours are shown. Although more detailed older maps exist for certain towns and rural estates, many landscape features make their debut on the six-inch maps, including many place names, often in use for centuries, but hitherto not located by maps.
Ordnance Survey in World War One
In 1914 as Britain entered the First World War, staff from Ordnance Survey were posted overseas. Working in appalling conditions, surveyors plotted the lines of trenches, it was a demanding, difficult and very dangerous job.
In 1914 the problem of obtaining information about German trench and artillery positions was very much in its infancy and the photographs taken had to be corrected to match the projection of the map. However this was overcome with the rapid development of aerial reconnaissance.
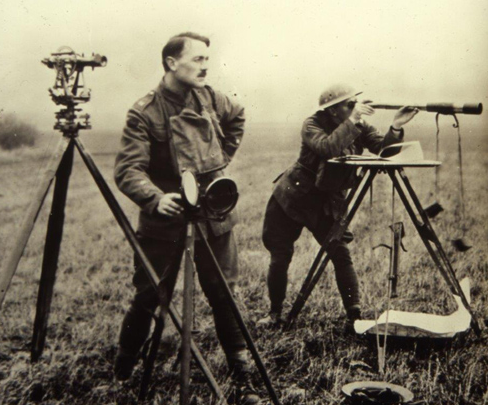 Royal Engineers from a Field Survey Company at work in WW1
Along with aerial reconnaissance techniques, radio signals were used as beacons for the first time to synchronise sightings of observation planes over enemy positions. Sophisticated calculations using both the sound and flash of enemy guns allowed German artillery to be plotted with high accuracy.
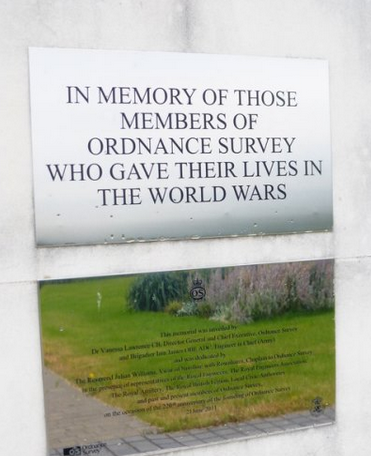 OS Memorial, Southampton HQ
Sixty seven Ordnance Survey staff were killed during the war and they are commemorated on a memorial in a peaceful garden besides the new Ordnance Survey head office in Southampton. Without their sacrifice and those of their more fortunate colleagues, many more of their countrymen would have been killed or injured. Fittingly the memorial is in the shape of a Trig Point.
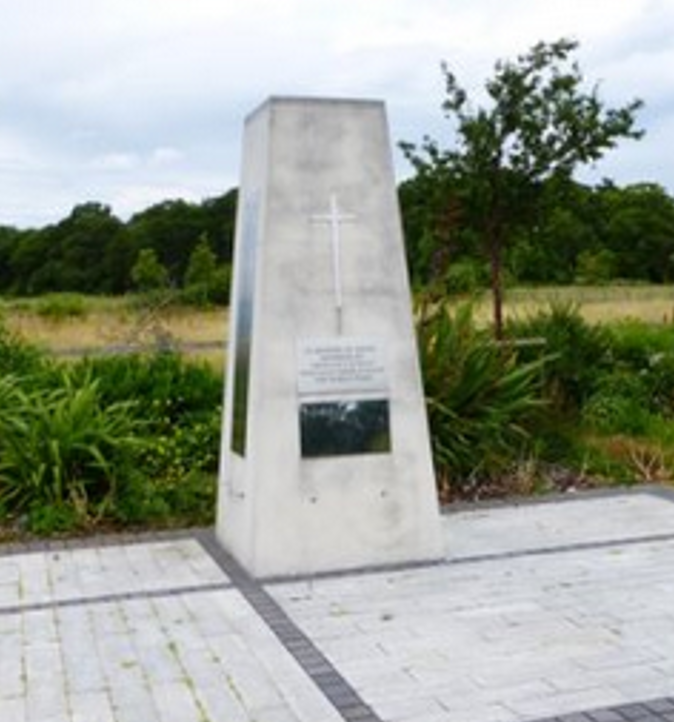 OS Memorial at Southampton
New Datum Point
Following the second Geodetic land survey of Britain between 1912 and 1921 the Tidal Observatory located adjacent to the lighthouse at the end of the South Pier in Newlyn, Cornwall was chosen to supersede Liverpool as the new primary datum point.
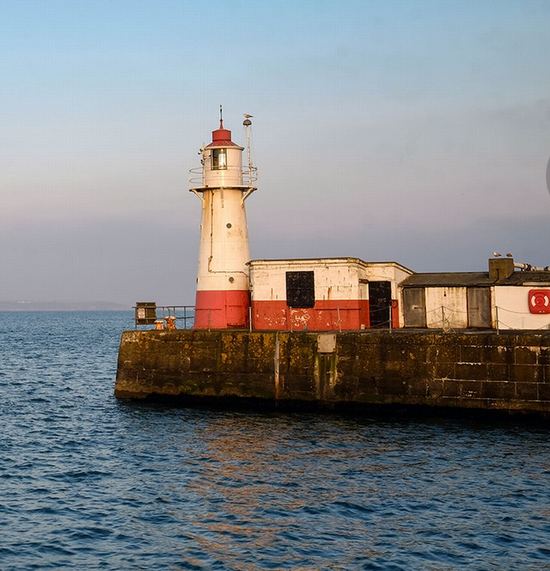 Newlyn Observatory (ODN) and lighthouse
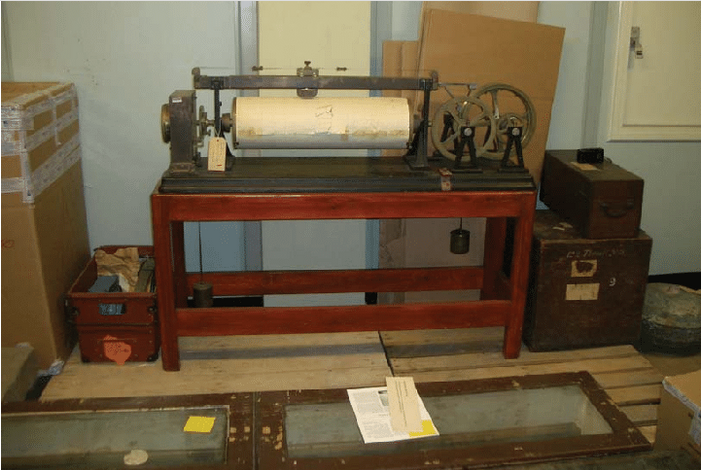 The original Cay Porter Tidal Gauge used at Newlyn Observatory
Triangulation Pillars
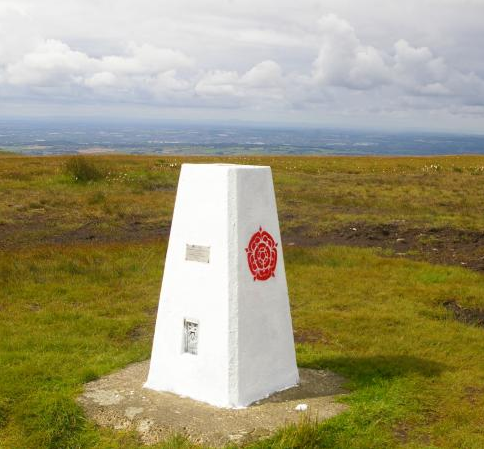
In 1935 an ambitious plan was undertaken to construct over 6,500 Triangulation Pillars (commonly known as Trig Points) on hills around the country, many on remote and inhospitable peaks. Teams of men had the demanding job of hauling heavy equipment up mountainsides in order to construct Trig Points, usually concrete pillars, although some are constructed of stones or other material and are of various shapes. In Scotland there are some taller cylindrical concrete pillars known as 'Vanessa's.
About four feet in height, a large brass bolt was secured to a concrete base in the ground, a brass rod enclosed in the pillar was then secured to the upper surface. Into the top of the pillar was set a brass fitting called a 'spider' incorporating three grooves 120° apart. In the middle of the spider is a removable plug. The spider and plug ensures that instruments can be automatically centred over the intersection of the three grooves when the feet of the theodolite are placed in the grooves.
A permanent structure providing a stable platform with a defined height above ODN ensured that during any future surveys the theodolite could be placed on exactly the same spot for accurate measurements.
Triangulation is basically a mathematical process that makes accurate map-making possible. It works by determining the location of a point by measuring angles to it from other Trig Points that are in line of sight.
Some of the more important trig points have a rectangular plate measuring roughly 6 inches by 3 inches called a flush bracket attached to one of the vertical faces. This is a bench mark showing height above seal level and is marked with 'OSBM' and a unique serial number.
The pillars are usually painted white, with some having logos displayed on them. The symbol for a trig point on an OS map is a small triangle with a dot in the middle.
 Trig Point No. TP0701 on Winter Hill - 1,496 (456 mtrs) above sea level
OS National Grid
The current National Grid is based on the OSGB36 datum (Ordnance Survey Great Britain 1936) and was introduced after the re-triangulation of 1936–1962 using Trig Points. It provides a unique reference system and can be applied to all modern OS maps of Great Britain, at all scales. Maps of Great Britain are covered by lines known as grid squares measuring 100 kilometres across. The area covers 700 kms from east to west and 1,200 kms from south to north. (Northern Ireland are included in the Irish OS National Grid which has it's own unique system).
The 100km grid squares that cover land are identified by two letters. There a 59 in total, Wigan is in grid square 34 which is prefixed with the letters SD.
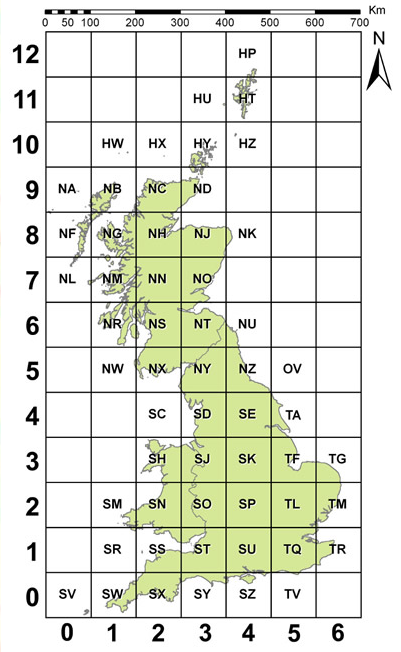 OS National Grid System of Great Britain.
Ordnance Survey in World War Two
The Survey’s most productive time was during World War Two, a third of Ordnance Survey’s civilian staff was called up for war service and its printing presses were kept busy with war production. For the Normandy invasion alone 120 million maps were printed and a total of 342 million produced for the entire war effort. During the heavy bombing of Southampton in November 1940 their offices were badly damaged and some valuable data was lost. This forced the Survey to temporarily re-locate their HQ to Chessington In Surrey. Here they produced 1 : 25,000 scale maps of France, Belgium, the Netherlands, Italy and Germany and detailed maps of the cities of Antwerp and Brussels.
OS Revision Points
Following World War Two urban surveyors made detailed maps of cities and towns and based their maps off small, unmovable features of the built landscape such as walls, corners of buildings, bridges, concrete posts, and kerbs etc. These were called ‘Revision Points’ that could be found again when a map was revised.
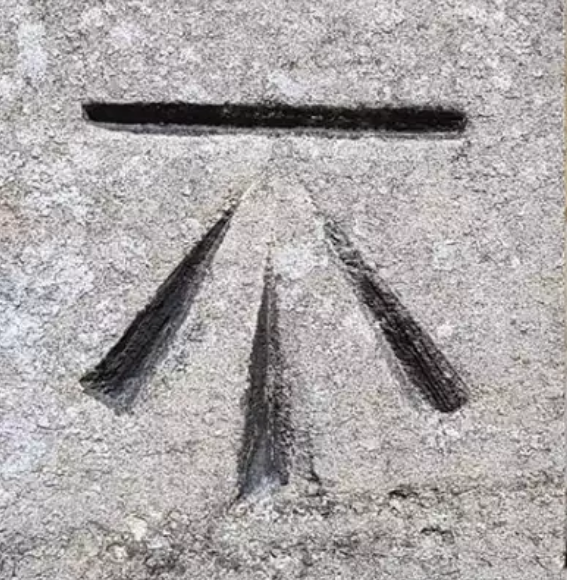
The method used was to photograph a field labourer pointing a white arrow at a centimetre accurate point. A photograph was then taken by the surveyor of his co-worker pointing the arrow. Next to him was a black board containing information such as the date, map reference, control point number and the number of the film strip on which the image was recorded. The board was nicknamed a ‘hymn board’ because of its similarity to the ones in churches displaying hymn numbers.
Once the survey was finished, the photos were collected into albums. As well as the information on the hymn boards, written descriptions were written under the photographs in the albums which were then stored in Ordnance Survey offices. Up until the 1980s people would still refer to them, but after satellite technology made them obsolete thousands of photos were destroyed, along with the arrows and hymn boards.
However, Manchester Central Library preserved a large collection of 46,000 prints dated 1946 onward, covering much of what is now Greater Manchester, including Wigan. These have been digitised and are a really valuable and important pictorial record of mid-20th century history.
Metrication
In 1969 the Imperial Measures scale was abandoned and OS adopted a metrication programme, with the 1 : 10,560 scale being replaced by the 1 : 10,000, the one-inch by the 1 : 50,000, and all contours and altitudes to be expressed in metric units.
There is a standard ratio format for map scales e.g. “1 : 25,000”. The first number is the unit on the map and the second number is the distance in real life of the same unit so 1 : 25,000 scale means that 1 cm on the map corresponds to 25,000 cms (250 metres) on the ground.
Bench Marks
Bench marks were carved by surveyors on buildings and walls and consisted of an arrow with a horizontal line above which denoted a specific height above sea level at that point. The broad arrow or ‘crows foot’ ordnance mark alludes to the military origins of Ordnance Survey. It has been used on British Army equipment since at least 1553, every item from a mess tin to a shirt, watch or compass has the arrow mark and identifies it as military and not civilian in origin.
 Bench mark symbol
Some 750,000 bench marks were created, largely concentrated in urban areas and mostly along roads. The last traditionally cut arrow style Ordnance Survey bench mark was carved in 1993. Many of these have now been lost, especially in cities and urban areas which have been re-developed and where old buildings and walls have been demolished. A variation on the bench mark is the spot height, which is not a physical feature but literally a spot on a map giving the elevation at that point.
Contour Lines
Contour lines are the red wavy lines drawn on a map connecting points of equal height and on this particular map are numbered in 25 feet intervals using ODL, the datum point in Liverpool.
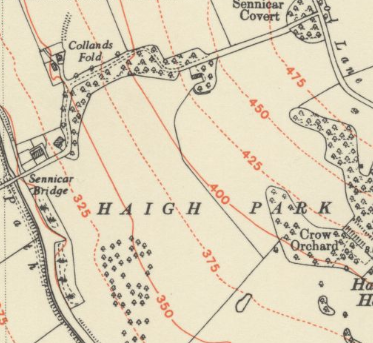 Haigh Park showing contour lines
A look at an area of to the north of Wigan
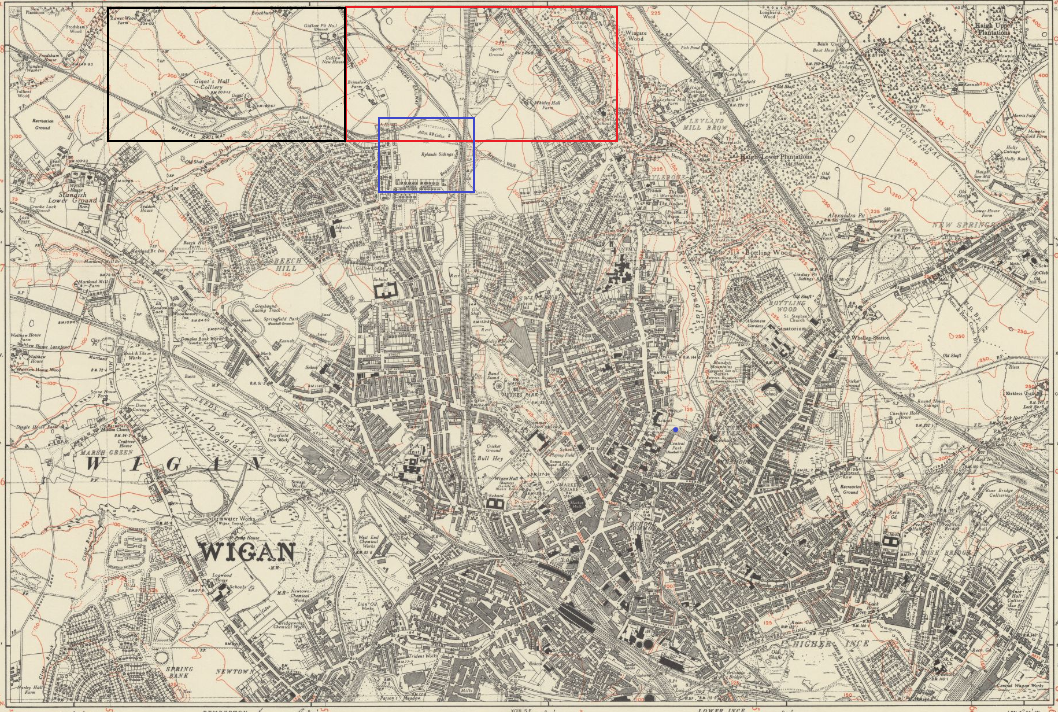 OS 6" Map of Wigan
The original map was published on 24 August 1849 and sold for the price of two shillings and six pence, a couple of days wages for a labourer. The map was relevelled in 1926, revised between 1938 and 1939 just prior to World War Two, additions were added in 1948 and the boundaries revised on 1 May 1950. It was published on 31 July 1951 by Ordnance Survey of Chessington in Surrey, costing 2 shillings to purchase.
The area was first surveyed in 1844 by five army officers from the Royal Engineers, headquartered in Southampton. Four Captains, Tucker, McKerlie, Hamley and Stanly, along with Lieutenant Bayly, walked hundreds of miles with theodolites surveying the landscape.
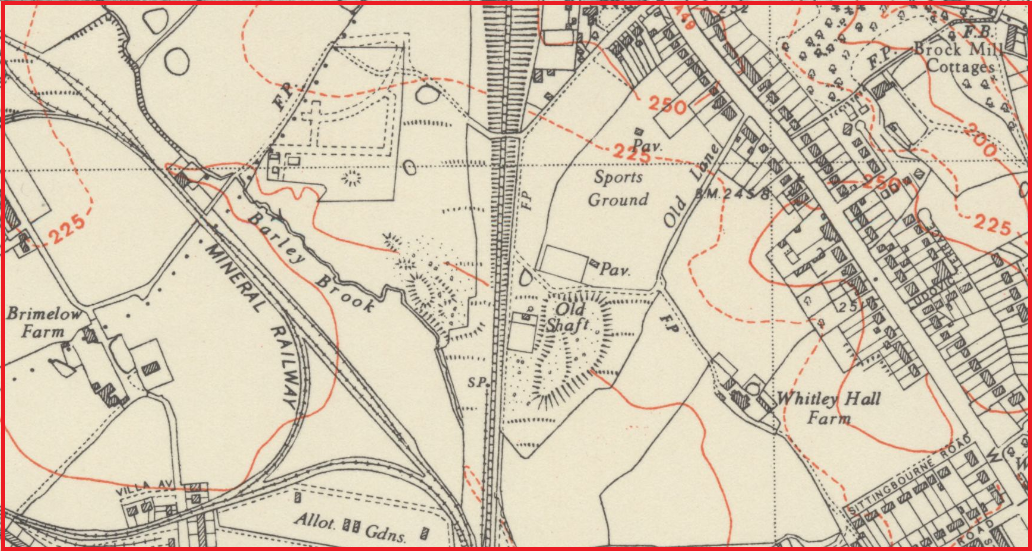 Section of map in red rectangle of large 6" map
In the top left quarter can be seen Barley Brook which runs down from Standish, past Gidlow Cemetery, through a culvert under the railway at Whitley, then mainly through underground tunnels, it cuts diagonally across Barnsley Street, Hodges Street, Gidlow Lane and Frog Lane before emptying into the River Douglas just behind the DW Stadium.
In between Barley Brook and the railway line is the newly built Gidlow Cemetery. The first burial was on 14 January 1948. Section 19, the Church of England burial plot, and Section 20, the Non Conformist burial plot can clearly be seen. Just to the west of the cemetery can be seen the initials FP, denoting a footpath and the dotted line alongside the footpath shows the line of the boundary between the Borough of Wigan and the Urban District of Standish.
The footbridge over the railway line from the bottom of Walter Scott Avenue was re-routed when the cemetery was later developed, but the map shows the original footpath pedestrian entrance to the cemetery going past a pond which is still there today surrounded by trees. The contour line running through Gidlow Cemetery shows that it is 225 feet above sea level.
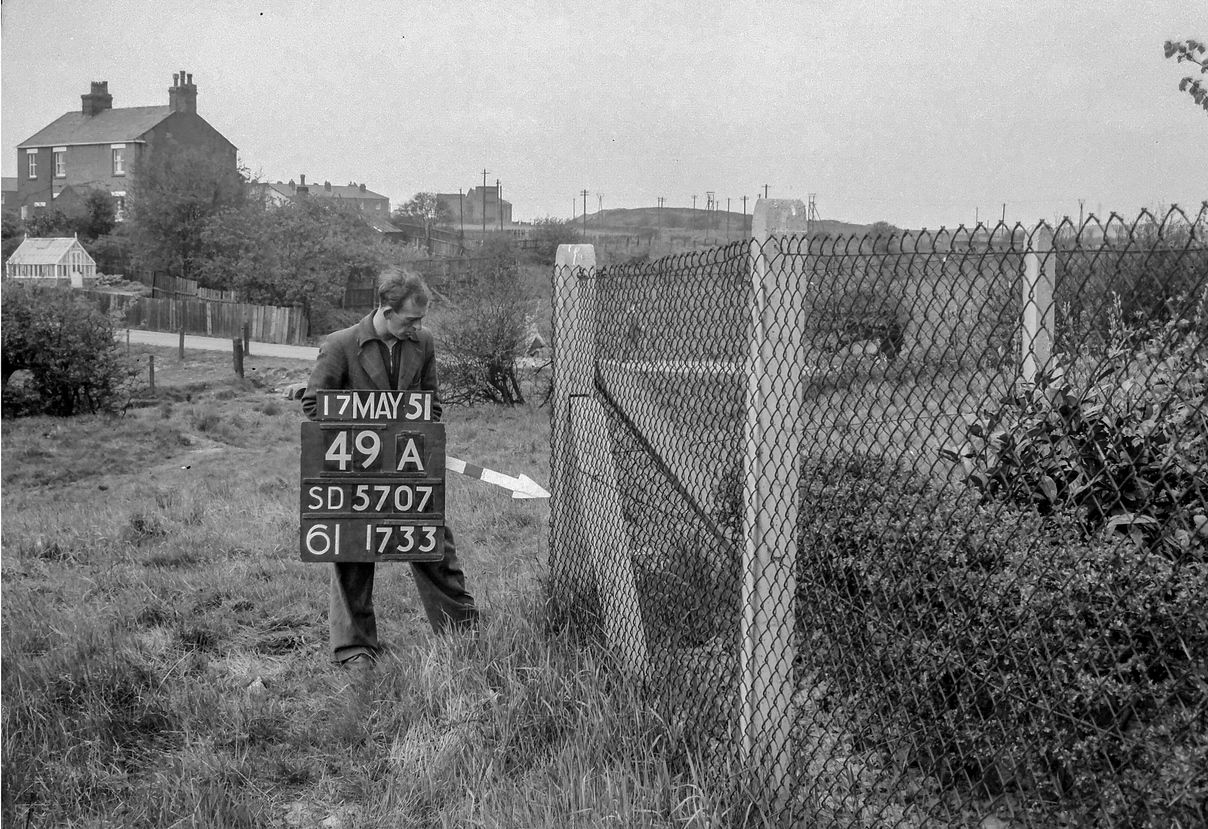 OS field worker marking a revision point at Gidlow Cemetery
Gidlow Houses (referred to as Gidlow New Houses on the 1951 map) can be seen in the distance and just to the right of them is Gidlow Pit No.1 which had ceased production in 1933 but was still showing on the 1951 map as disused. The pit spoil heap can be seen above the fence posts.
Referring back to the map, running vertically down the centre is the main London to Glasgow railway line passing through Whitley. The arrowhead symbols either side of the line denote a slope, the base of the arrow is high ground and the point of the arrow is low ground, so it is indicating a cutting where it passes under Boars Head bridge. The initials ‘SP’ at the bottom of the map denotes a signal point controlling rail traffic on and off the railway sidings near Rylands Sidings signal box. The layout of the mineral railway line can be seen linking the rail sidings at Whitley with Giants Hall Pit and John Pit.
The Eastern Side of the Railway Line
The configuration of the arrowhead symbols round the words ‘Old Shaft’ to the east of the railway line show that it is a hill. As youngsters we knew it ‘Scouts Hill’ but it is in fact spoil from Elms Colliery which was located at the spot. The pit was opened in 1880 and had several owners, finally closing in 1905. A smaller spoil heap on the other side of the railway we called ‘Cubs Hill.’
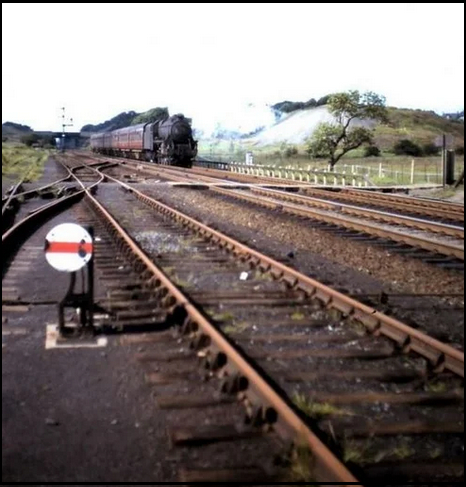 Whitley Crossing looking north along the West Coast Main Line
The map shows that by 1948 a sports ground had been developed in between Walter Scott Avenue and Old Lane. It included two pavilions, a football pitch and also tennis courts which were located on the top of Scout's Hill. Before the present housing estate was built the site was occupied by Whitley High which closed in 1990.
A comparison of the same map which was revised in 1927 to 1928 and published in 1930 shows that the area around Whitley Hall Farm was Whitley Park Golf course. It stretched from the railway up to Wigan Lane and its clubhouse was accessed via a track from present day St. Clements Road.
Every dwelling on Wigan Lane is marked showing the size and shape of garden. On Old Lane is the information ‘BM 245.8’ and just to the north of the contour line crossing Wigan Lane is an arrow symbol on the left hand side of the road denoting a ‘Bench Mark.’. The modern benchmark archive shows it at 286 Wigan Lane and is at 245.8 feet above sea level.
A footpath can be seen leaving Wigan Lane just south of Old Lane, as youngsters we knew it as ‘64 Steps’. It runs past Sicklefield House and down to the footbridge over the River Douglas past the now demolished Brock Mill cottages.
The missing ROF armaments factory
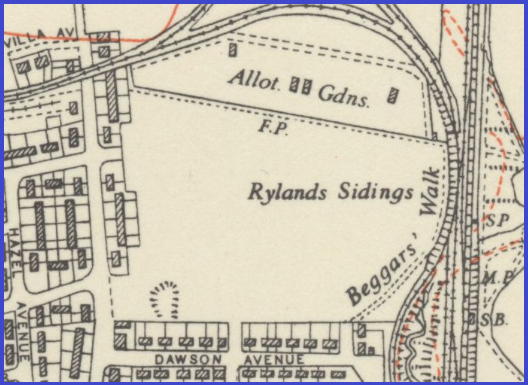 Section of map in blue rectangle of large 6" map
The area is shown as it was in 1939 before the factory was built with allotments and footpaths crossing the land. To the right along the railway can be seen the letters 'SP' denoting a signals point, 'MP' a mile post, and 'SB' a signal box which the authors grandfather worked in during the late 50's and early 60's. The de-classified sheets have now been deposited in some of the Copyright Libraries, helping to complete the map-picture of pre-Second World War Britain.
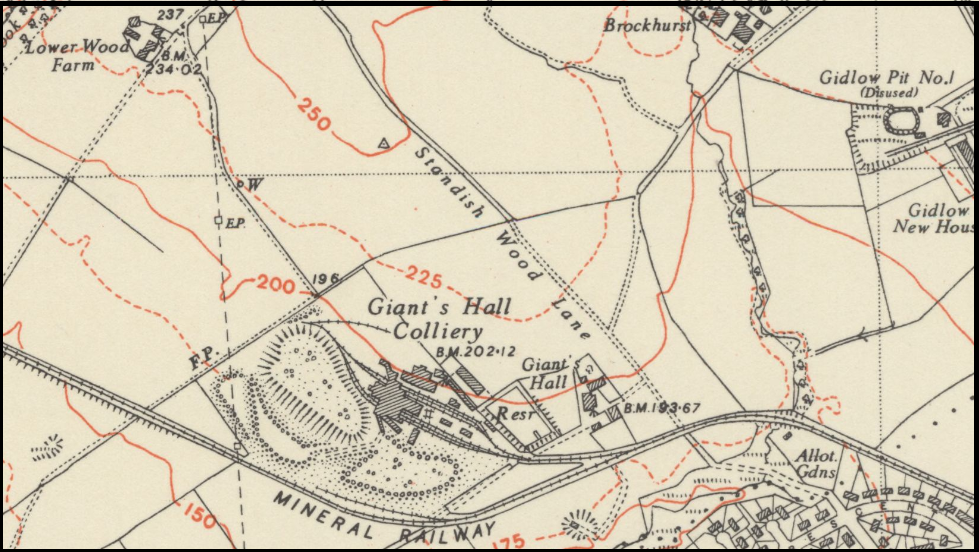 Section of map in black rectangle of large 6" map
Another track runs south east from the farm toward Giants Hall, on the 225 contour line is a small circle with the letter 'W' at the side, this shows the location of a well. The track turns west towards Standish Lower Ground at spot height 196 just north of Giants Hall.
Standish Wood Lane runs diagonally across from north west to south east. It is accessible by vehicle at the northern and southern ends but the middle section is not suitable for through vehicular traffic. The path is an ancient right of way linking Standish with Wigan, at the northern end it links up with Beech Walk which terminates at St. Marie's RC church on the B5209 road at Standish. At the southern end it enters Beech Hill housing estate at Willow Road. To the left of Standish Wood Lane on the 250 contour line a trig point symbol is shown (now not shown on modern maps).
The layout of Giants Hall Colliery, which was still in production at the time can be seen with the spoil heaps to the west. A building at the northern end has a bench mark showing a height of 202.12 ft. The reservoir which is now a fishing lodge is to the west and next to that is Giants Hall Farm which also has a bench mark showing a height of 192.67 ft.
The mineral railway that linked Whitley Sidings with John Pit and Taylor Pit runs along the bottom of the map and the branch line into Giants Hall Colliery can be seen. Just to the south of the line can be seen a track leading to a depression in the ground with a building in the middle. This was the magazine where all the explosives were stored for the colliery.
Just to the north of the houses alongside Standish Wood Lane is an allotments garden, this was later used as garages for nearby residents. At the top of the map is Brockhurst Farm which was linked by tracks to Standish Wood Lane near Giants Hall Farm, Gidlow Houses and Wigan Road, Standish at the now main entrance to Gidlow Cemetery.
The 150 ft contour line can be seen rising by 25 feet intervals up to an elevation of 250 feet showing the ground rising from south to north towards Standish.
The 1951 6" OS map is a snapshot in time of how the area looked over seventy years ago. A comparison with the modern 1 : 25000 OS map below shows how the area has changed, with the extension of the cemetery, more housing, and the new factory at Giants Hall surrounded by woodland.
Some features have disappeared such as the collieries, mineral lines and electricity pylons and much of the land has returned to nature. Note the old war time ROF factory (Millikens Carpets) is now shown to the east of the Beech Hill housing estate. The Trig point on Standish Wood Lane is no longer displayed but the 'well' is still shown along the track in between Lower Wood Farm and Giants Hall Farm.
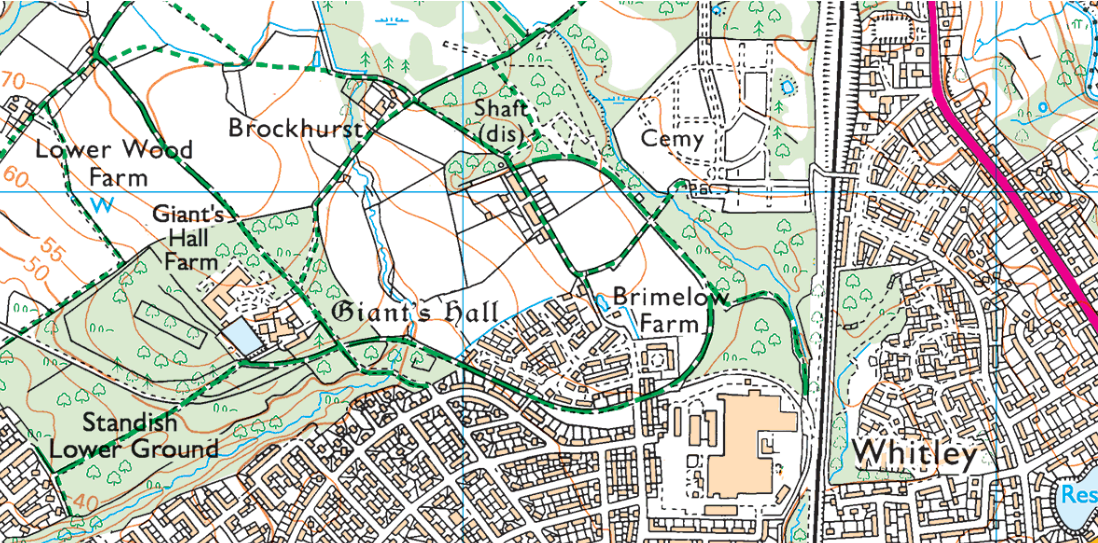 How the area looks today on a modern OS 1 : 25000 (Explorer Series) map
Over the years Ordnance Survey has produced many millions of maps of various scales including the City and County series, and for specific users such as walkers, road users and long distance routes. The most popular ones are the famous 1 : 25,000 Explorer Series aimed at walkers and the 1 : 50,000 Landranger Series which is used by walkers and road users alike.
In 1983 the last military personnel left Ordnance Survey, making it a wholly civilian organisation. Since 1 April 2015 Ordnance Survey has operated as Ordnance Survey Ltd, a government owned company, 100% in public ownership.
Today with modern surveying techniques utilizing aerial photography, satellite imagery, and computerization, cartography has been revolutionised. Ordnance Survey operate two aircraft solely devoted to aerial survey, they notch up around 50,000 miles a year as part of the Survey’s ongoing work to update its digital master map of Britain All 243,241 square kilometres of Great Britain are surveyed and up to 20,000 changes are put into the database daily.
With over 230 years of experience Ordnance Survey maps are of such quality and accuracy that they set the standard of map making around the world. However while OS still produces a comprehensive range of printed leisure maps, the digital side of the business accounts for more than 90% of turnover.
Graham Taylor October 2022
Sources
Atlasobscura – article by Cara Giamo
Google Maps
Lonewalker.net
National Library of Scotland
Ordnance Survey
OS Benchmark Archive
Ordnance Survey for GOV.UK – article by Melanie Osborne
Timepix
Trig Pillar Map
Wikipedia